Young women earn less than young men from the very start of their working lives.
We have analysed official labour market statistics to understand both:
- Hourly pay differences (the conventional gender pay gap measure), and
- Annual earnings differences (our income gap measure)
Together, these show how early inequalities in pay and working patterns combine to create a much larger gap in total income.
Methodology
We commissioned economists at Braw Data to conduct a statistical analysis of data using the UK Labour Force Survey collected by the Office of National Statistics. The analysis used multivariate modelling to estimate:
- Hourly pay gaps between men and women (gender pay gap measure)
- Annual earnings gaps between men and women (income gap measure)
Both were analysed conditional on a wide range of individual, job and employer characteristics, including age, education, industry, occupation, hours worked, length of employment, region, marital status and caring responsibilities.
This approach allows us to distinguish between:
- Differences in where men and women work (sectors, occupations, hours), and
- Differences in how men and women are rewarded even when they are otherwise similar.
Key Findings
There’s more to financial inequality than the official gender pay gap
Official gender pay gap statistics mask the scale of the divide between men and women’s pay.
Official gender pay gap statistics are based on hourly pay. For young women, this gap appears relatively small at 2.25% at the time of writing.
This can give the impression that financial inequality is limited, particularly at younger ages.
However, when we look at annual earnings, a very different picture emerges.
Young women aged 18–30 take home, on average, around a fifth less per year than young men of the same age.
That is a huge difference of £5,080 per year. The median annual income for a young man aged 22–29 is £29,268, compared with £24,188 for a young woman.
This is the income gap.
Pay gaps start small, but grow over time
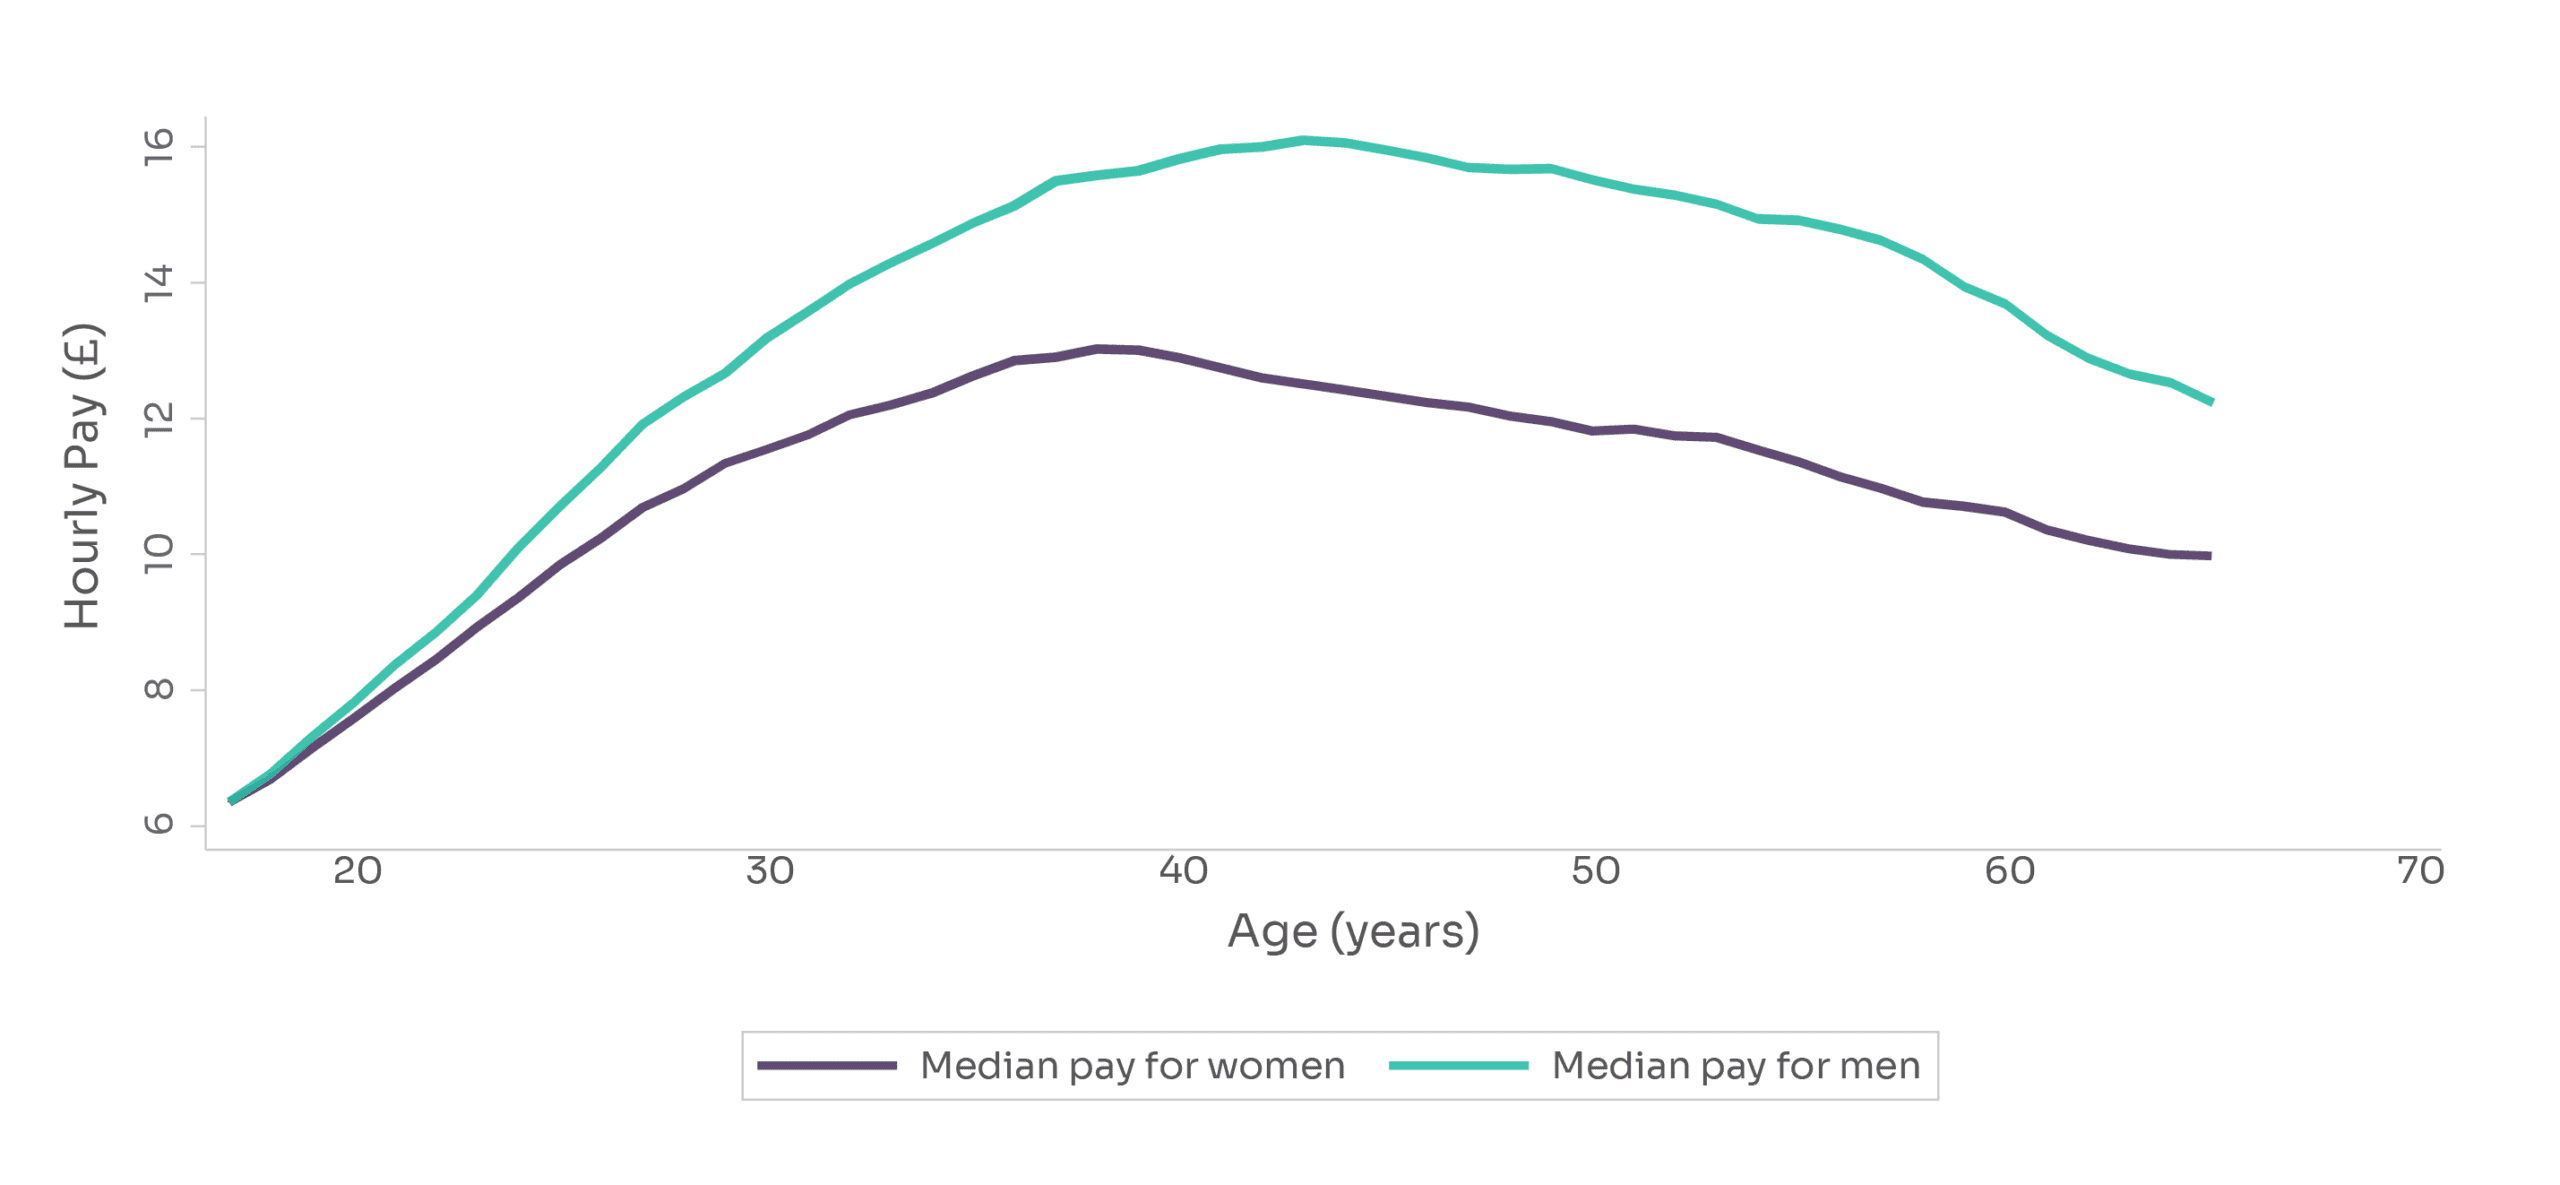
Figure 1: Hourly pay by age (gender pay gap measure)
Figure 1 (above) shows how median hourly pay for men and women changes with age.
The gender pay gap (hourly) is small in early working life but widens steadily through workers’ 20s and grows further over time.
Early inequalities compound as careers progress.
By understanding the causes of the gap for workers in their 20s, we can find solutions which will tackle the problem early and prevent the gap from growing further.
What causes the income gap?
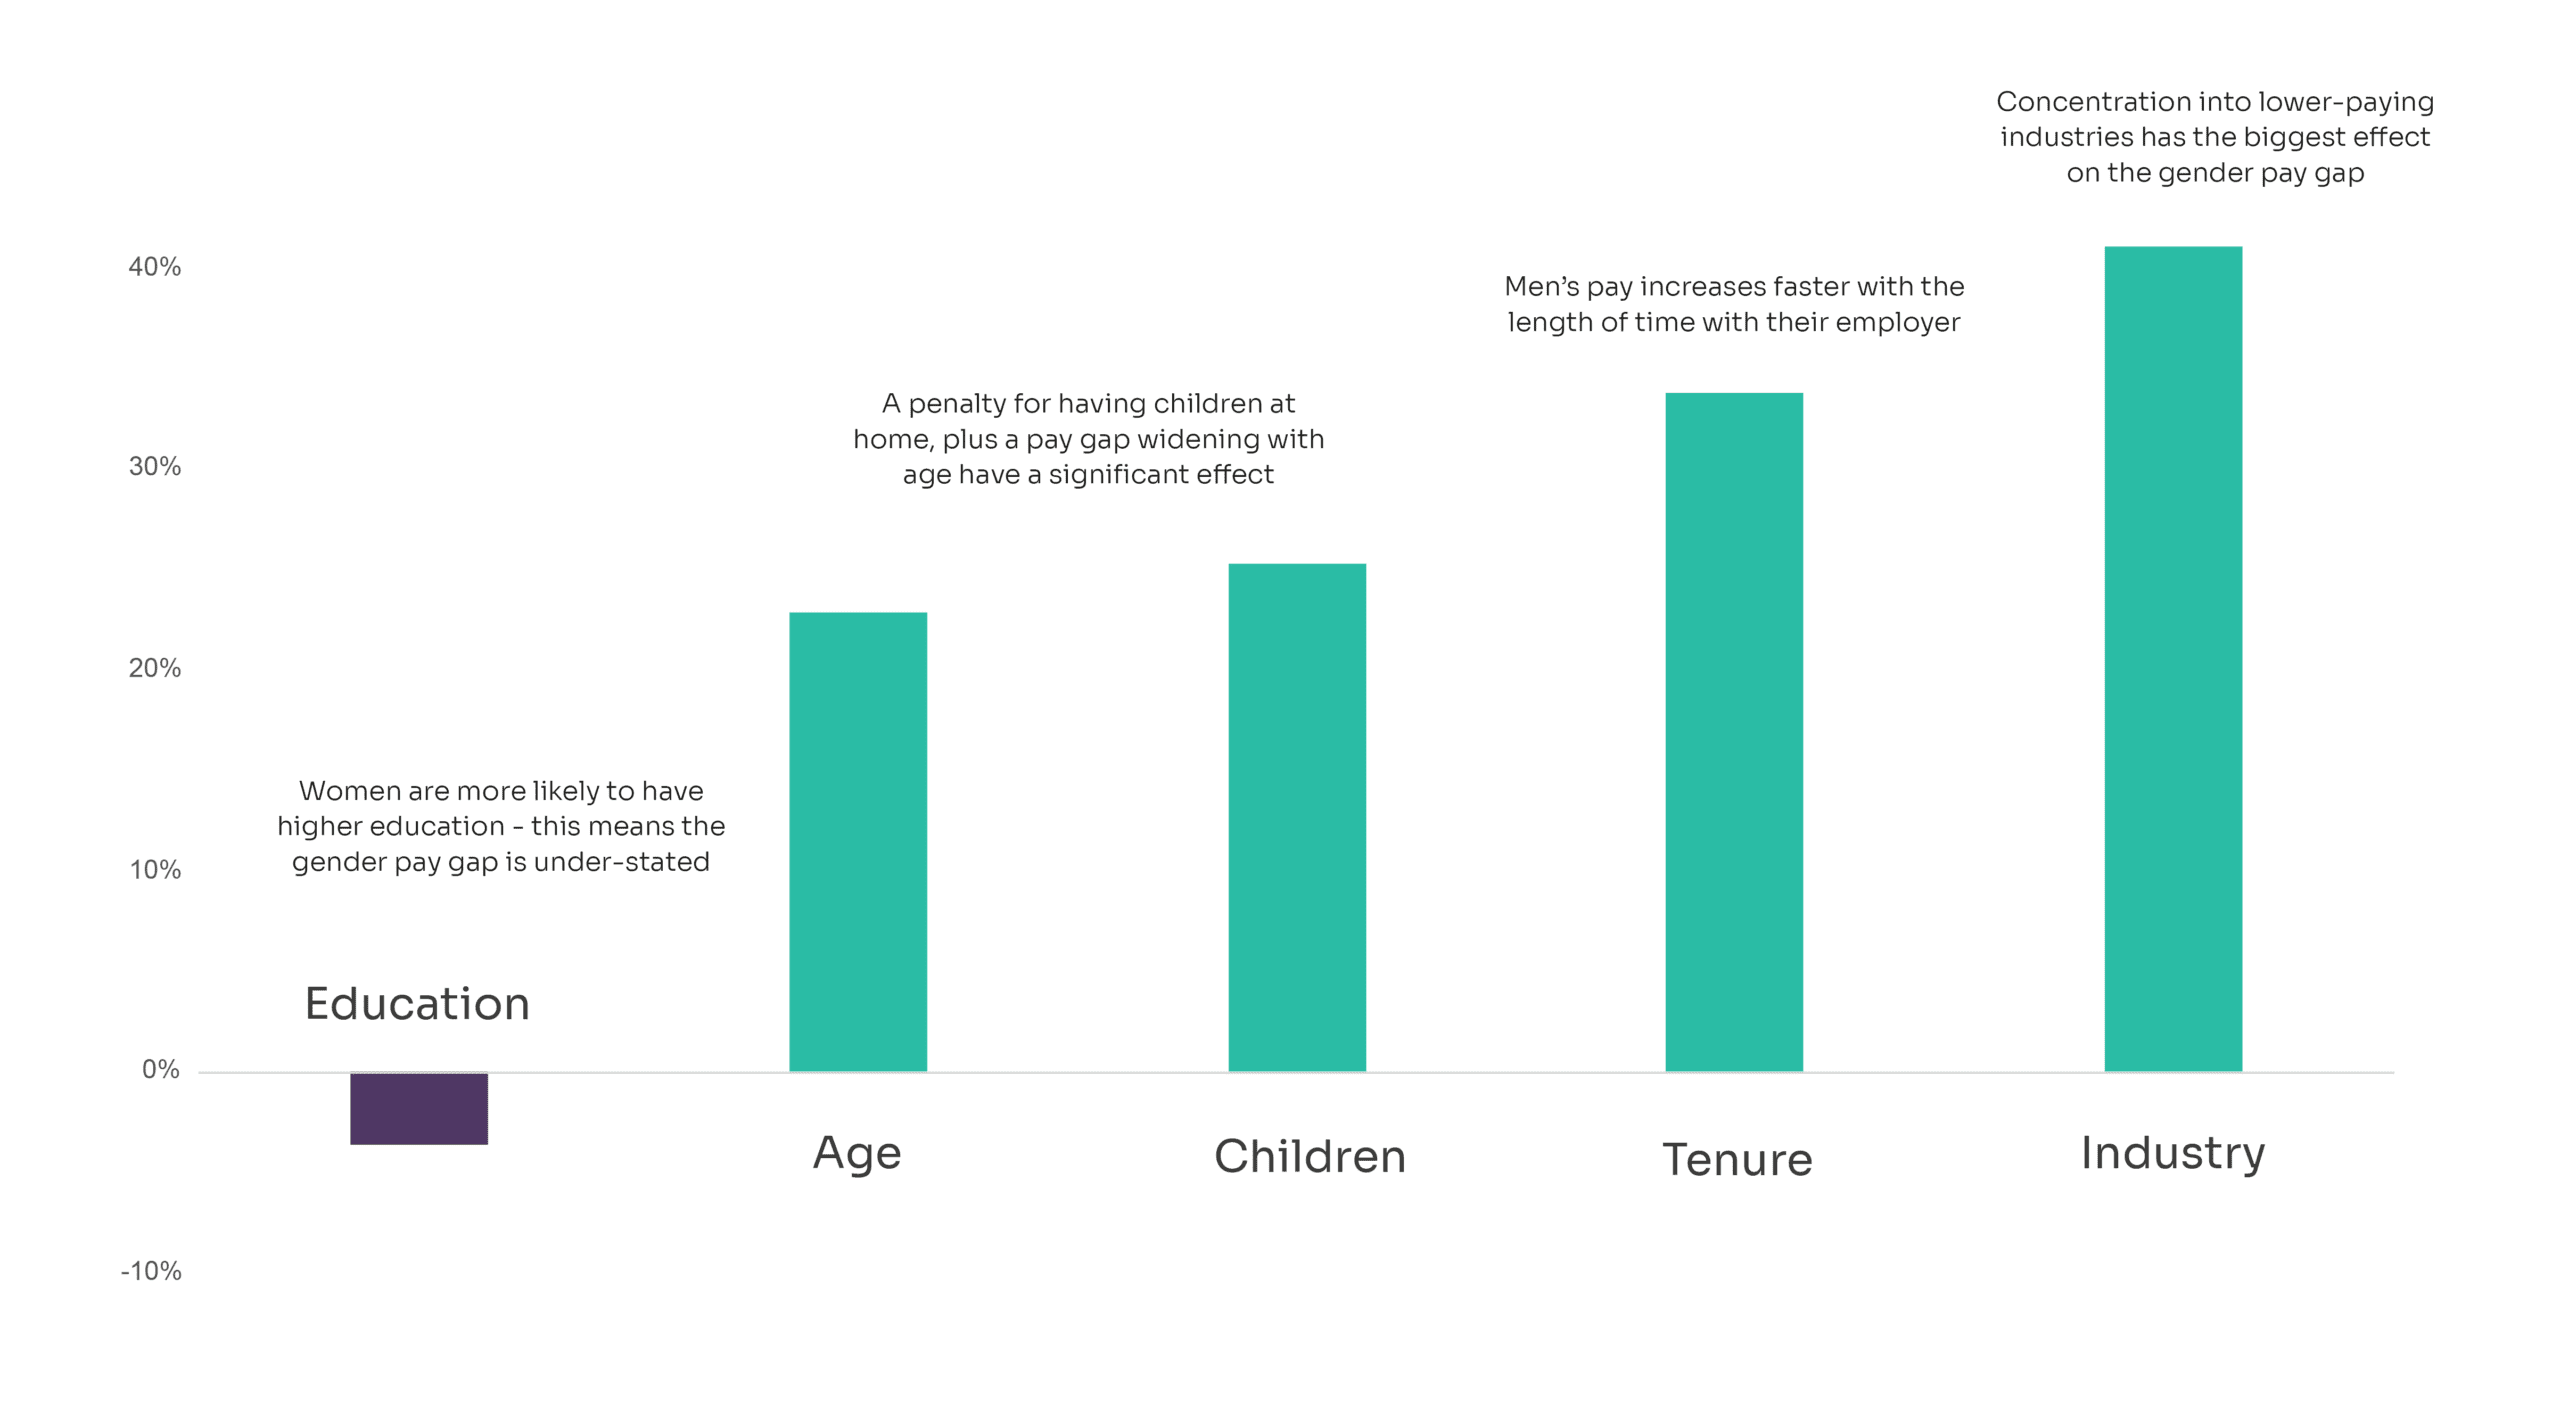
Figure 2: Factors contributing to the annual income gap (ages 16–30)
Figure 2 (above) shows the factors contributing to the annual income gap between young men and women. Values above zero increase the income gap; values below zero reduce it.
About one fifth of it is down to men and women going into different jobs and sectors
Young women are more likely to work in industries where pay is lower overall, or where the types of jobs that women tend to do are lower paid.
Women are getting funnelled into lower paid jobs and sectors at a young age and getting stuck there – so where women go in the 18-22 age range has long-term implications for lifetime earnings and progression.
For young women, the biggest sector driver of the income gap is information and technology, a higher paid sector where men are more likely to work.
Meanwhile, many young women are concentrated in sectors that rank among the lowest paid, including:
- Health and social work
- Wholesale and retail trade
- Hospitality
- Other service activities ((this includes membership organisations, trade unions and politics, hairdressing, and physical wellbeing activities such as gyms)
- Admin and support services
- Arts, entertainment and recreation
Many young women are also in industries which aren’t necessarily low paid, but which have large pay gaps.
The top 5 industries with the biggest hourly pay gaps for workers aged under 30 are:
- Electricity and gas
- Financial and insurance
- Mining and quarrying
- Other service activities
- Professional, scientific and technical activities (this includes things like law, accountancy, engineering, management consultancy and PR).
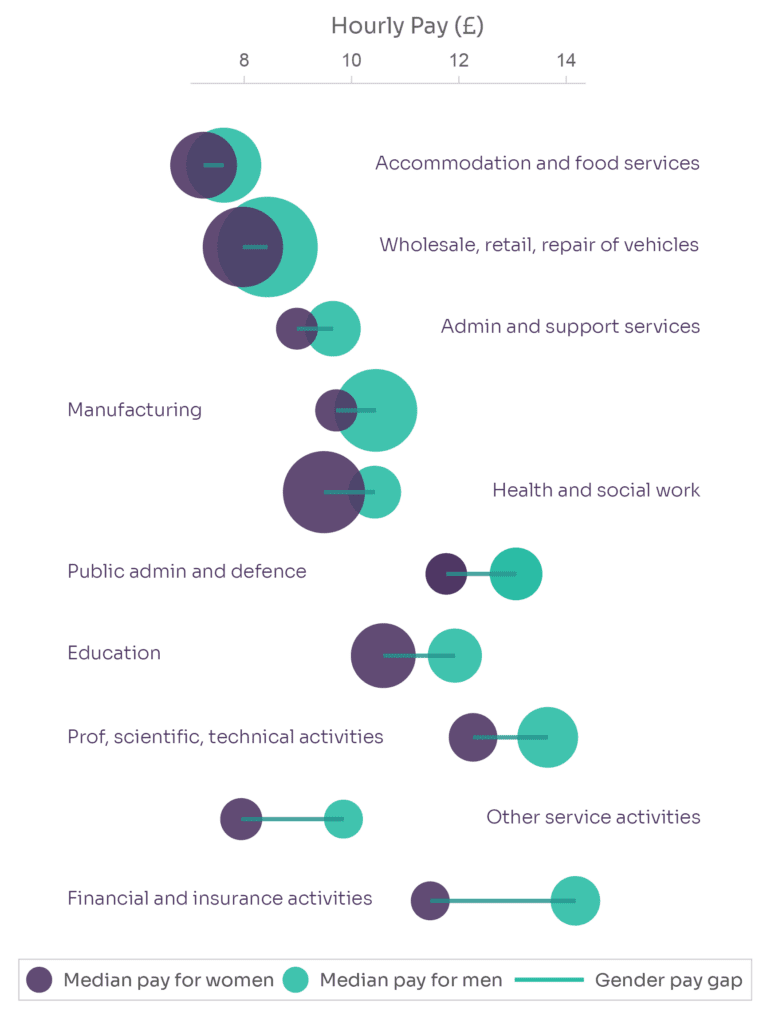
Figure 3: Gender concentration, hourly pay, and hourly pay gap by sector
Figure 3 (above) illustrates the extent of the gender pay gap in the top 10 industries where the most young women are concentrated. The size of the circle represents the number of young women and young men working in each industry, and the line between the two circles represents the size of the pay gap. The larger the line, the bigger the pay gap.
More information on the classifications of industries used is here.
About two thirds of the income gap occurs as a result of pay penalties and premiums within similar jobs
Even when men and women work in similar roles and sectors and have similar characteristics, women experience financial penalties that men do not.
Examples include:
- Larger financial penalties for women with children than men working in the same sector
- Higher length of service premiums for men
- Slower progression rates
- Career interruptions (e.g. motherhood) affecting income trajectories
- Discrimination
This shows that the income gap is not only about where women work, but also how they are treated within work.
The triple-whammy effect of part-time work
Women are more likely to be working fewer hours in part-time roles, which are lower paid and offer fewer progression opportunities. This creates a compounding effect on annual income.
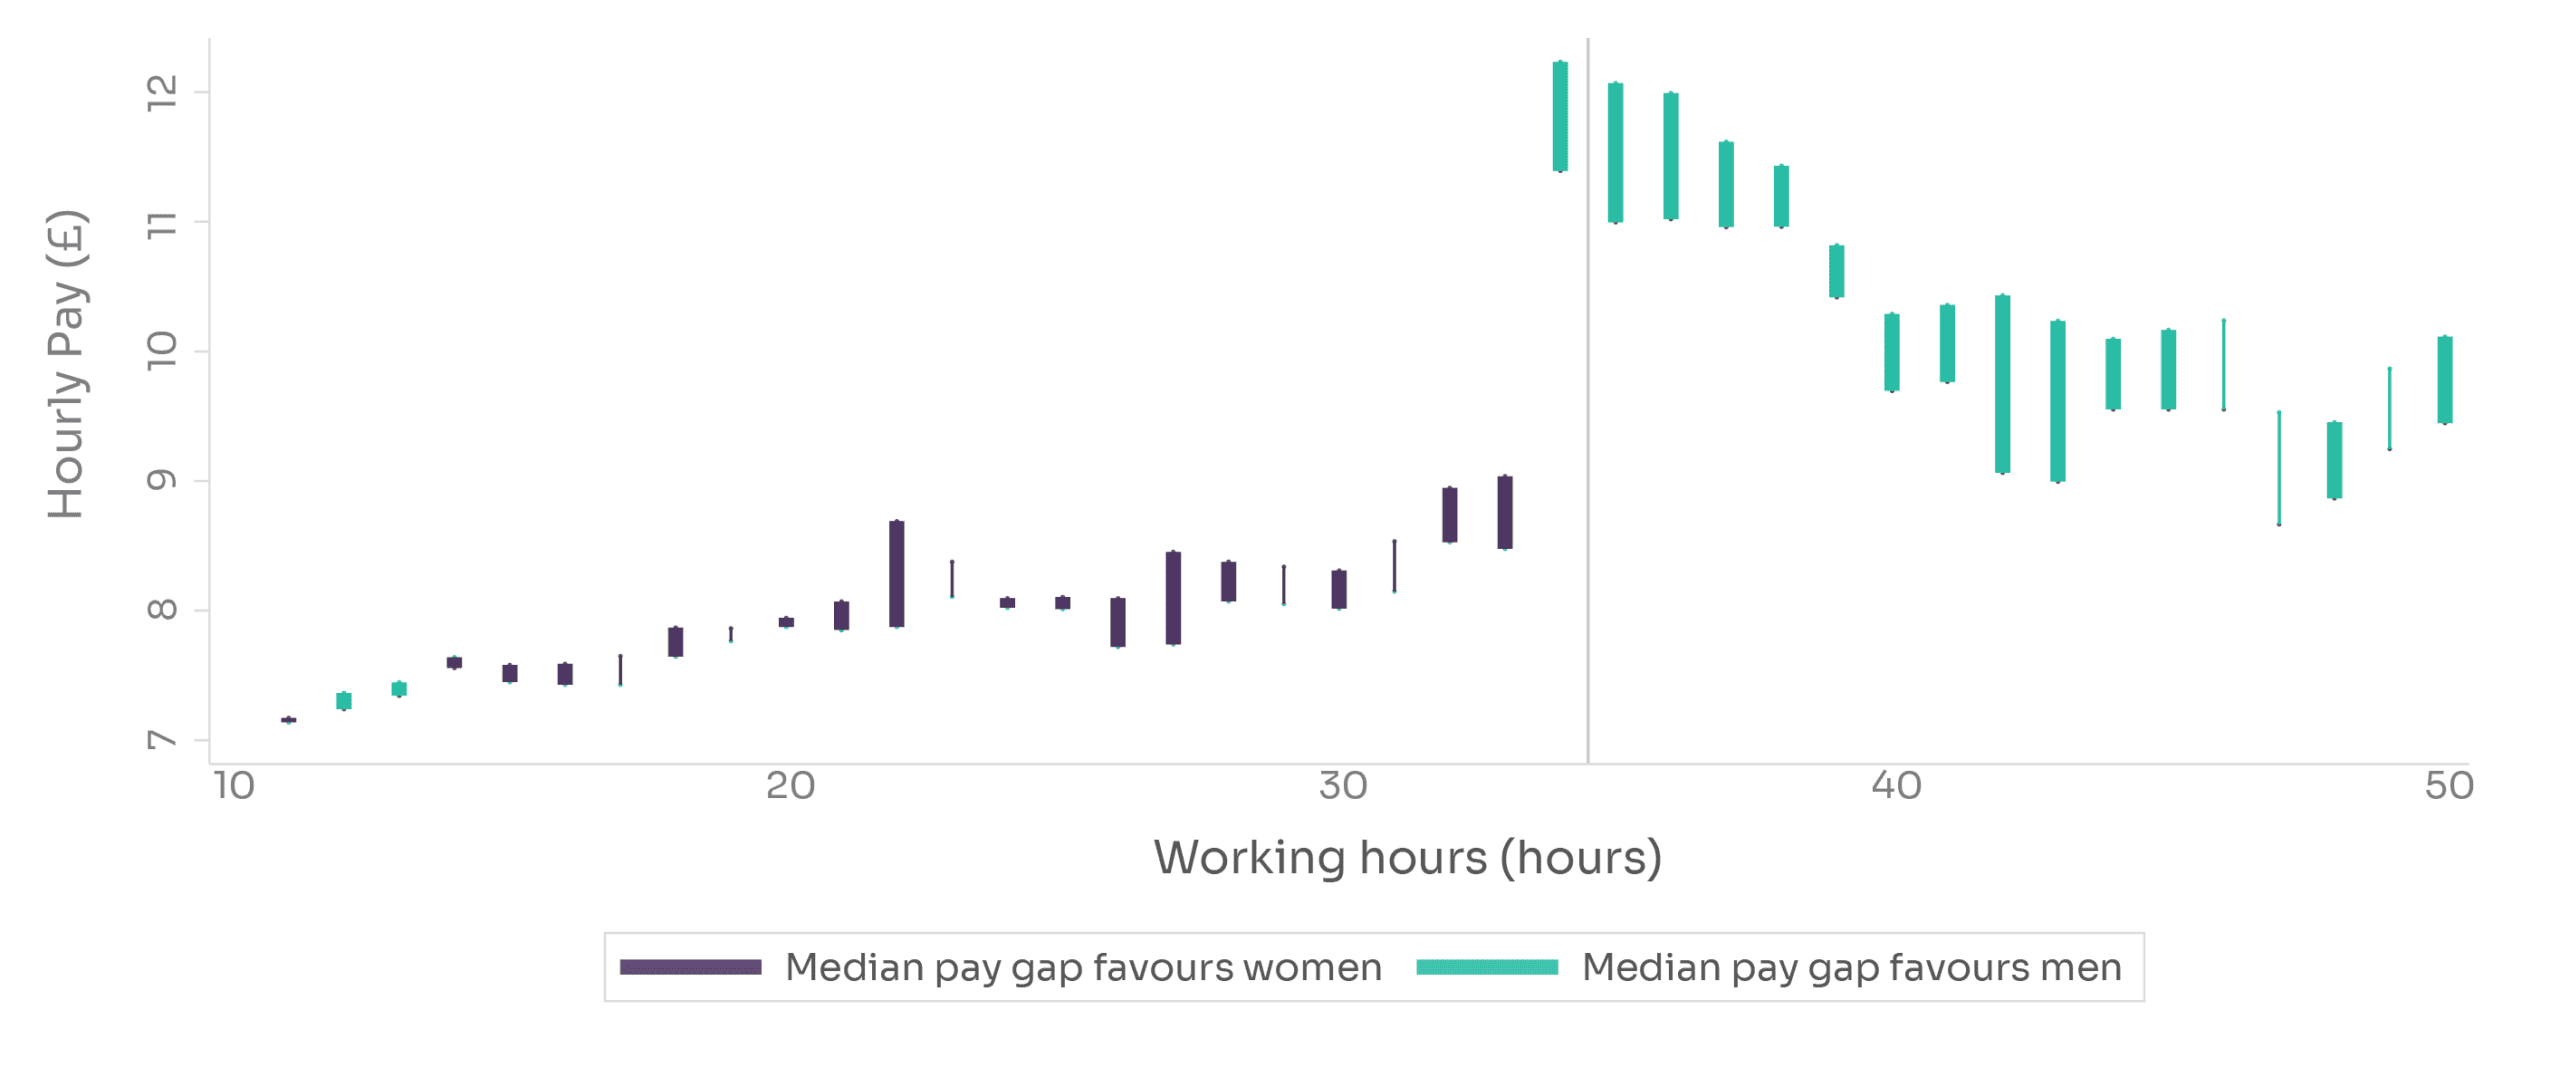
Figure 4: Hourly pay and median pay gap by weekly working hours and gender
Figure 4 (above) shows how hourly pay increases sharply when moving from part-time to full-time work, as well as an hourly pay gap that shifts from being slightly in favour of women to favouring men.
Even for younger workers, women are more likely to work in part-time jobs.
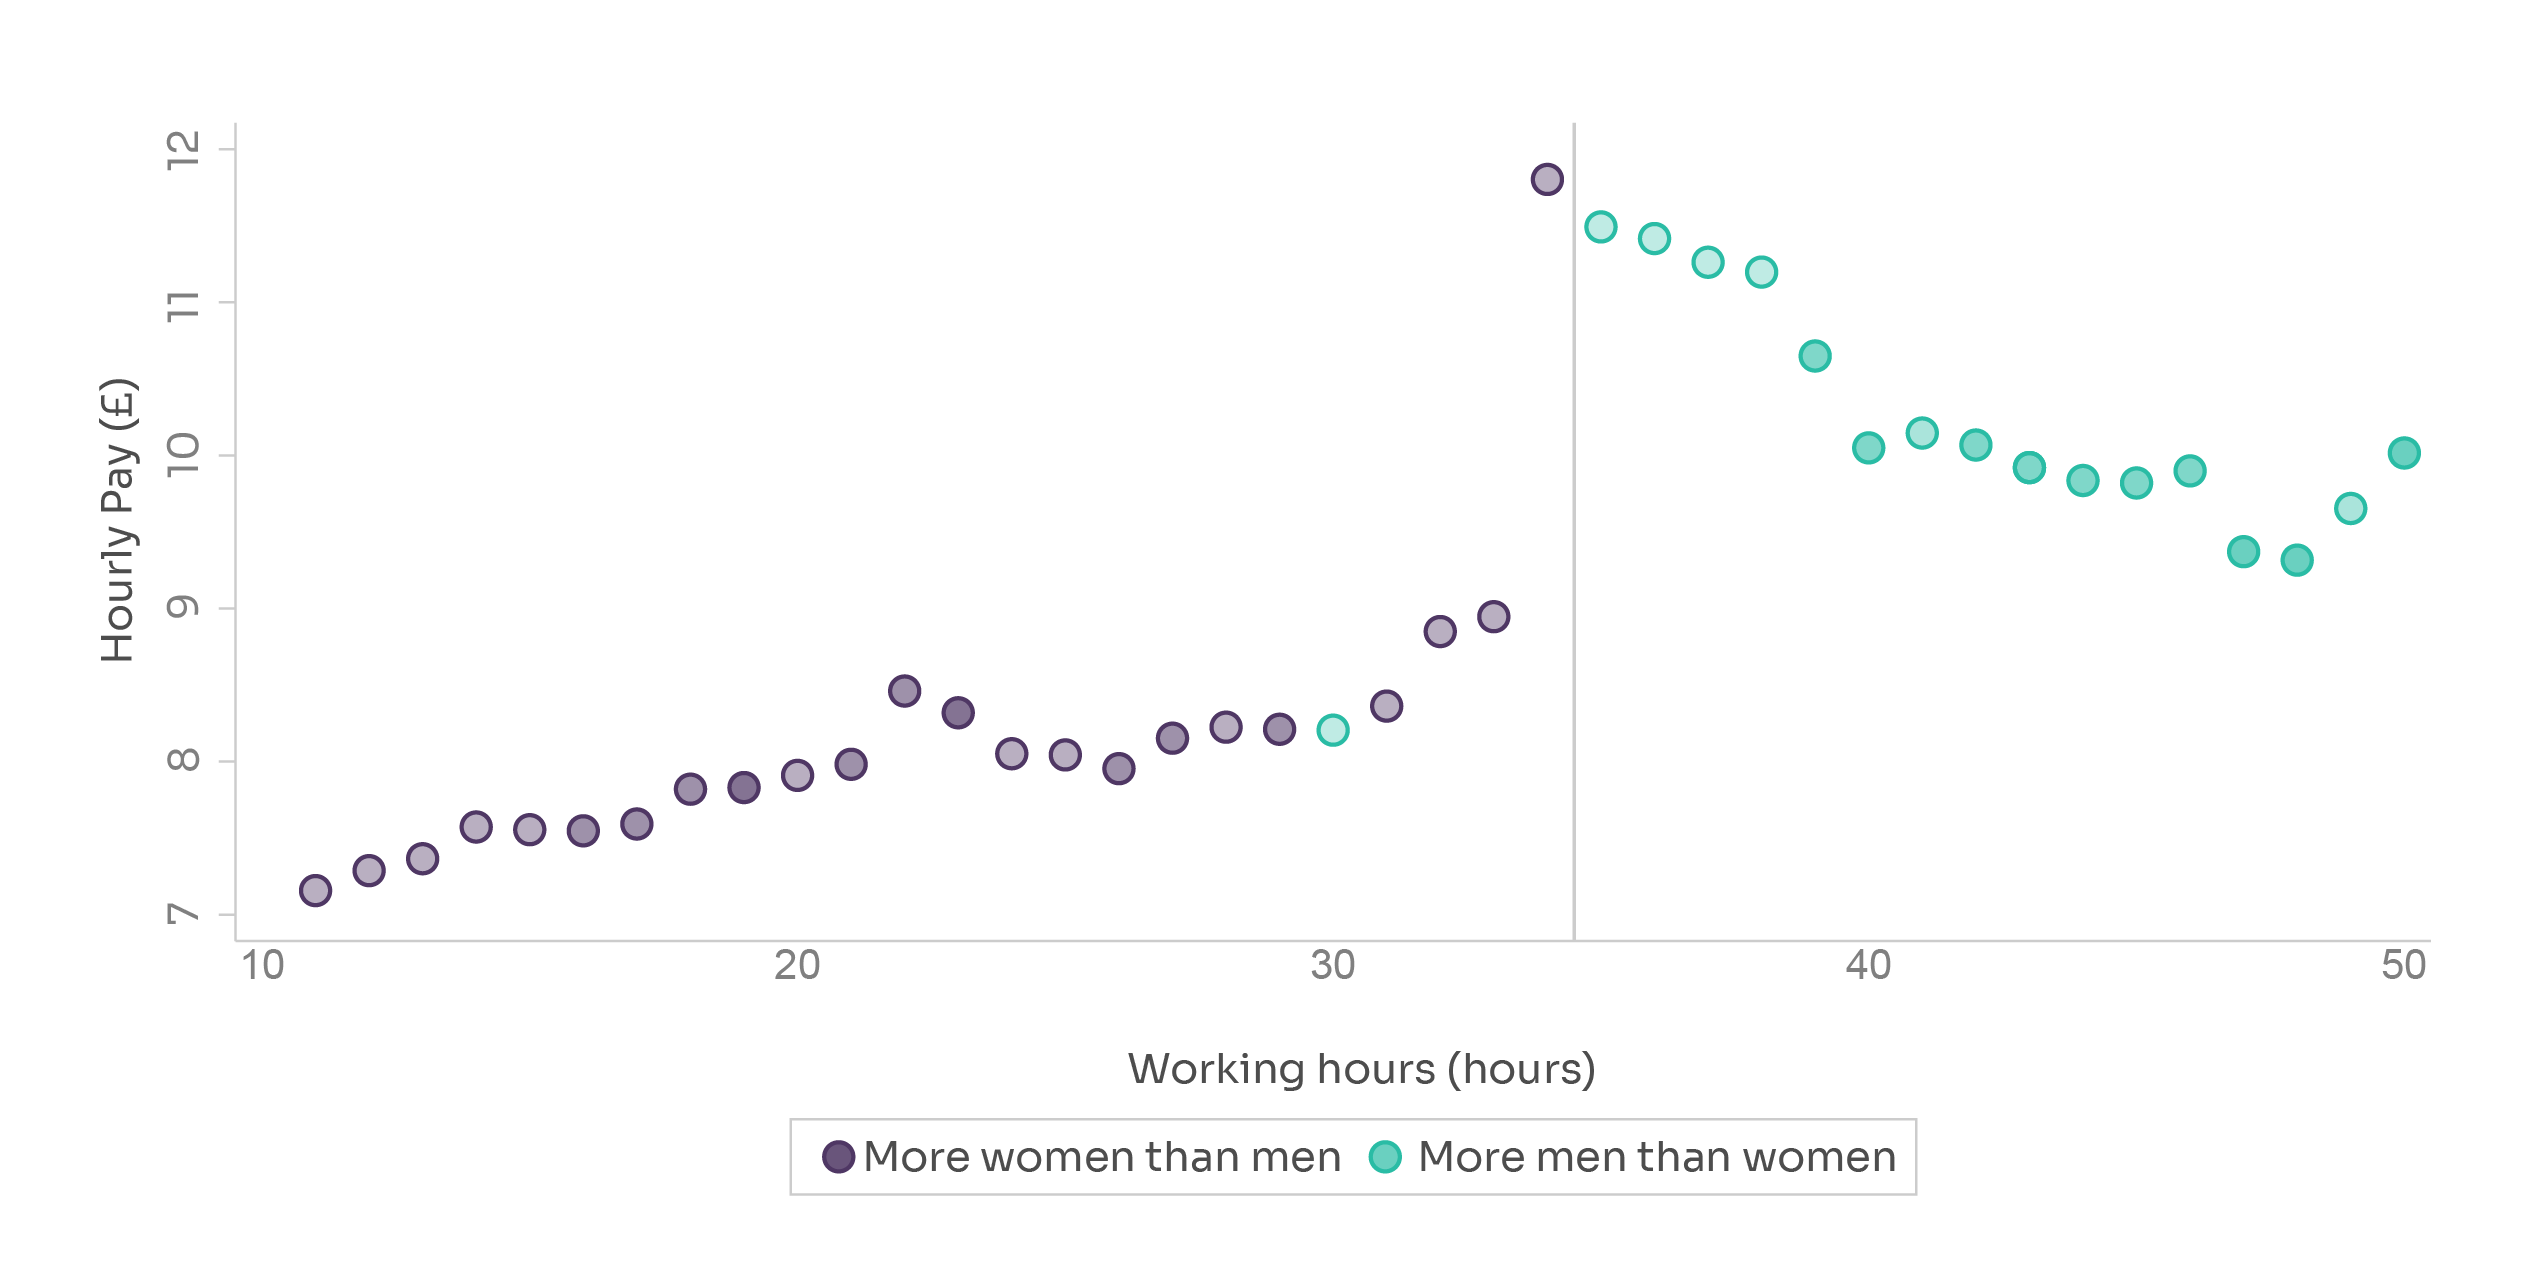
Figure 5: Distribution of working hours by gender and median hourly pay
The graph above illustrates how women are concentrated in part-time, lower paid roles – while men are more represented in full-time work. This structural difference directly feeds into the annual income gap.
If men were educated as highly as women are on average, the income gap would be even bigger
Young women are more likely than young men to have degree-level qualifications – significantly more than half of employees with degrees are women. However, the financial return on education is lower for women.
This means:
- Young men get paid more for having a degree than young women
- Young women are investing in their futures but not getting the same return on that investment as men.
- The income gap persists despite more women having a degree (which increases their average pay) than men.
Men are more likely than women to be rewarded for staying in a job longer
Our analysis indicates that men receive higher income premiums for longer service than women, particularly in the 18–30 age group. This reflects faster progression and stronger early career mobility for men.
Why early income gaps matter
All of this means that young women are setting out on an unequal path.
Earning less at the start of their working lives has long-lasting effects on women’s finances and creates long-term financial inequality.
Lower early income can result in women:
- Taking on more debt
- Having less savings
- Finding it more difficult to get on the property ladder
- Being less financial resilient
- Progressing more slowly than men
The dynamics that produce lifetime financial inequality start young and grow over time.